

Image Details
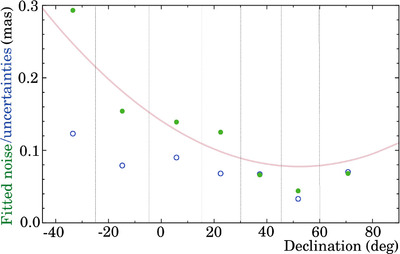
Caption: Figure 16.
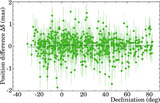
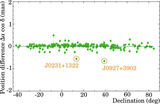
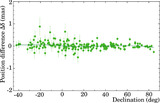
The green solid circles show the position differences in decl. from the analysis of VLBA data at 2.2/8.4 GHz vs. 23 GHz at seven decl. segments. The blue hollow circles show the median K-band position uncertainty. The pink solid line shows the predicted additional variance in decl. due to residual errors in the ionospheric contribution to the path delay (Petrov 2023).
Other Images in This Article
Show More
Copyright and Terms & Conditions
© 2024. The Author(s). Published by the American Astronomical Society.

Copyright ©
2026 Astronomy Image Explorer. All Rights Reserved.
