

Image Details
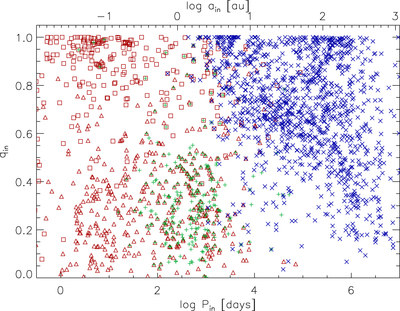
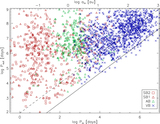
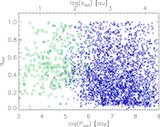
Caption: Figure 7.
Periods and mass ratios of inner subsystems in known hierarchies within 100 pc. The SB1 and SB2 orbits are plotted by red squares and triangles, respectively, astrometric orbits by green pluses, and resolved subsystems by blue crosses. The mass ratios of SB1s and astrometric binaries are lower limits. The upper axis gives orbital separations for a mass sum of 2 M ⊙.
Other Images in This Article
Copyright and Terms & Conditions
© 2023. The Author(s). Published by the American Astronomical Society.

Copyright ©
2026 Astronomy Image Explorer. All Rights Reserved.
