

Image Details
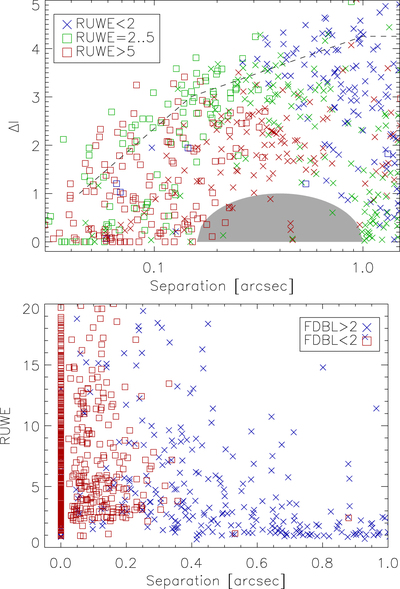
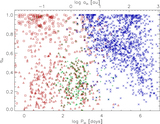
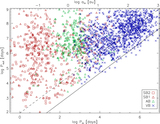
Caption: Figure 6.
Comparison between SOAR resolutions of candidate subsystems and Gaia binarity flags. Top: magnitude difference ΔI vs. separation for resolved pairs. The crosses indicate FDBL > 2 (effectively resolved by Gaia) and the squares mark FDBL < 2. The colors show RUWE < 2 (blue), between 2 and 5 (green), and > 5 (red). The gray shade indicates the Gaia avoidance of binaries, the dashed line is the median detection limit. Bottom: RUWE vs. angular separation. The blue crosses and red squares distinguish targets by FDBL.
Other Images in This Article
Copyright and Terms & Conditions
© 2023. The Author(s). Published by the American Astronomical Society.

Copyright ©
2026 Astronomy Image Explorer. All Rights Reserved.
