Image Details
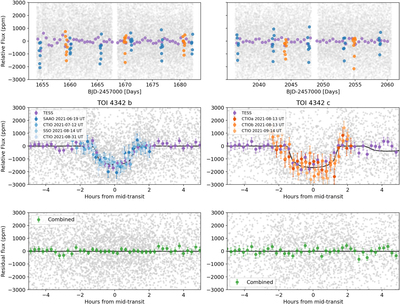
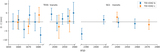
Caption: Figure 3.
Top: detrended TESS light curve in gray, binned values in purple, with transits highlighted for each TOI 4342 b (blue) and TOI 4342 c (orange). Middle: TESS and LCOGT light curves folded on the best-fit period and epoch found in Section 3.2.1. Different background-subtracted observations are shown in different colors for each transit with the best-fit model in black. Bottom: residual flux between the fully combined light curve and the model.
Other Images in This Article
Copyright and Terms & Conditions
© 2023. The Author(s). Published by the American Astronomical Society.
Copyright ©
2025 Astronomy Image Explorer. All Rights Reserved.