

Image Details
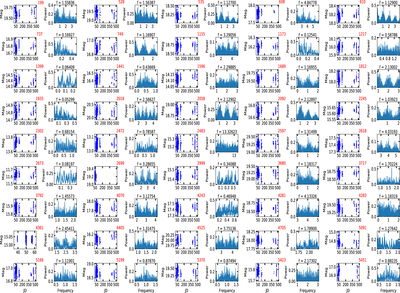
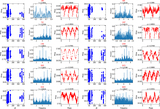
Caption: Figure 14.
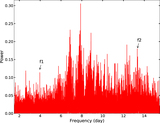
Plots of magnitude vs. Julian date and Lomb–Scargle periodogram for the 45 variable stars whose phase-folded light curves are shown in Figure 3. The star IDs and phase-folding frequencies are given at the top of each subplot.
Other Images in This Article
Show More
Copyright and Terms & Conditions
© 2023. The Author(s). Published by the American Astronomical Society.

Copyright ©
2026 Astronomy Image Explorer. All Rights Reserved.
