

Image Details
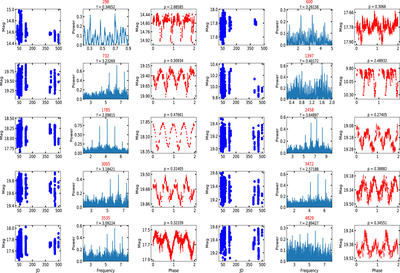
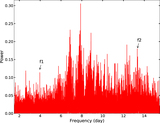
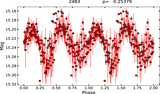
Caption: Figure 6.
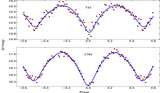
The original light curves (left subplot), Lomb–Scargle periodograms (middle subplot), and phase-folded light curves (right subplot) of each eclipsing binary star found in the NGC 381 region. The periods (p) and corresponding frequencies (f) are also shown in the subplots. Star IDs are given at the top of each plot.
Other Images in This Article
Show More
Copyright and Terms & Conditions
© 2023. The Author(s). Published by the American Astronomical Society.

Copyright ©
2026 Astronomy Image Explorer. All Rights Reserved.
