

Image Details
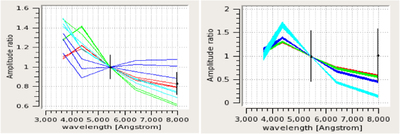
Caption: Figure 11.
Plots of amplitude ratios for mode identification through the FAMIAS package using multiband photometric data. The left and right panels show plots of the amplitude ratios for stars 2483 and 1596, respectively. Modes l = 0, 1, 2, and 3 are shown by red, green, blue, and cyan respectively.
Other Images in This Article
Show More
Copyright and Terms & Conditions
© 2023. The Author(s). Published by the American Astronomical Society.

Copyright ©
2026 Astronomy Image Explorer. All Rights Reserved.
