Image Details
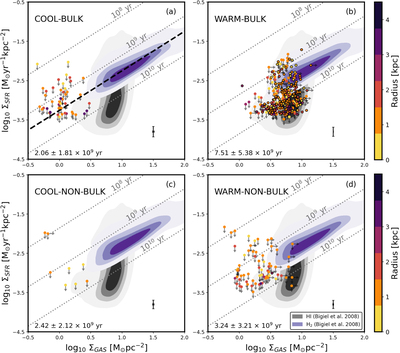
Caption: Figure 10.
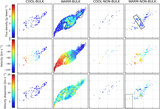
The K-S law for gas components of each group varying with its galactocentric radius from 0 to 4.5 kpc. Panels (a)–(d) represent the resolved K-S law for the cool-bulk, warm-bulk, cool-non-bulk, and warm-non-bulk components onto the K-S law of H I (gray) and H2 (blue) gas investigated in Bigiel et al. (2008). The points with upper limits of ΣSFR are the gas components where the velocity profile is decomposed into more than one Gaussian component. The points with black edges present gas components whose velocity profile is decomposed into one Gaussian (i.e., SGfit) or have two or three Gaussians, but all of them are classified into the same group. The points with lower limits of ΣGAS indicate regions where H2 gas clouds are detected by previous studies. The dotted lines indicate the gas depletion time (τ dep), by which gas is consumed to form stars in 108, 109, and 1010 yr. The x-axis and y-axis error bars located in the lower right of each panel indicate the background uncertainties estimated from H I and the combination of FUV and MIR images, respectively. The x-axis error is 0.013, 0.003, 0.012, and 0.007 dex for panels (a), (b), (c), and (d), respectively. The mean τ dep of classified components is denoted in the bottom left corner of each panel.
Other Images in This Article
Copyright and Terms & Conditions
© 2022. The Author(s). Published by the American Astronomical Society.