Image Details
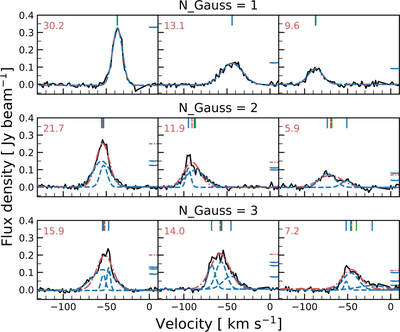
Caption: Figure 4.
Nine arbitrarily chosen velocity profiles (black solid lines). From top to bottom, the optimal number of Gaussians describing the individual line profile is 1, 2, and 3. The left, middle, and right columns present velocity profiles whose peak S/N estimated from SGfit is larger than 15, between 15 and 10, and between 10 and 5, respectively. The red dashed-dotted and blue dashed lines present the SGfit and OptGfit results, respectively. The central velocity measured by MOMENTS (green solid), SGfit (red dashed-dotted), and OptGfit (blue dashed) is indicated as vertical lines on the top of each panel. The flux densities derived from SGfit and OptGfit are also shown as horizontal lines on the right of each panel. The estimated peak S/N value of the SGfit result is shown in the top left corner of each panel.
Other Images in This Article
Copyright and Terms & Conditions
© 2022. The Author(s). Published by the American Astronomical Society.