Image Details
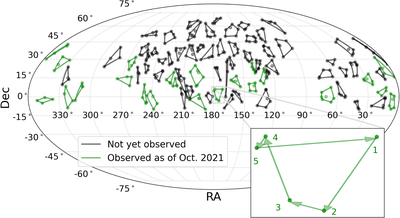
Caption: Figure 3.
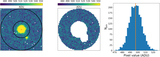
A sky map of the PINES sample. Targets that have been observed as of 2021 October are shown in green, while those that have yet to be observed are shown in black. Individual targets are shown as filled circles, while groups of targets are outlined with solid lines. The inset shows a zoom-in on one group and visualizes the order in which its members were targeted during PINES observations.
Other Images in This Article

Show More
Copyright and Terms & Conditions
© 2022. The Author(s). Published by the American Astronomical Society.
Copyright ©
2025 Astronomy Image Explorer. All Rights Reserved.