Image Details
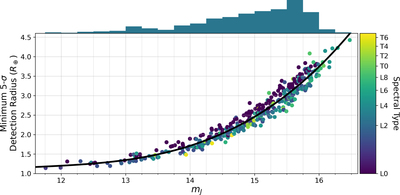
Caption: Figure 10.
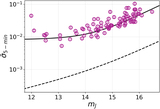
Estimated J-band transit-detection sensitivity for all of the targets in the PINES sample (colored points), assuming purely Gaussian noise as determined by the J-band noise model shown in Figure 9. Astrophysical or systematic noise sources, which are not captured in this model, will degrade this sensitivity estimation. Targets in this panel are colored by their spectral type, and the black line shows a third-degree polynomial fit to the points. The histogram above the axis shows the J-band magnitudes of targets in the PINES sample (the binning matches that in the top panel of Figure 2).
Other Images in This Article

Show More
Copyright and Terms & Conditions
© 2022. The Author(s). Published by the American Astronomical Society.
Copyright ©
2025 Astronomy Image Explorer. All Rights Reserved.