Image Details
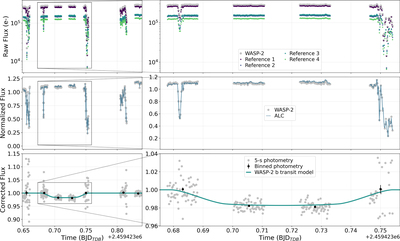
Caption: Figure 11.
Transit recovery of WASP-2 b on UT 2021 July 28. The rows show different stages of PAT, going from raw flux to a final light curve. The left column shows the full night of data, while the right column shows a zoom-in on the four blocks that cover the transit event. Top: raw flux measured for WASP-2 and four reference stars. Middle: the normalized flux of WASP-2 and the ALC constructed from the weighted mean of the four reference stars. Bottom: the normalized flux for WASP-2 corrected by the ALC and a linear baseline, along with a transit model of WASP-2 b.
Other Images in This Article

Show More
Copyright and Terms & Conditions
© 2022. The Author(s). Published by the American Astronomical Society.
Copyright ©
2025 Astronomy Image Explorer. All Rights Reserved.