

Image Details
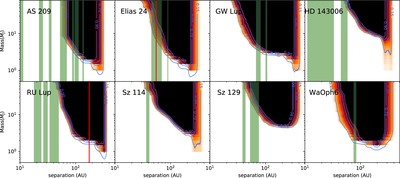
Caption: Figure 3.
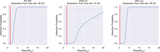
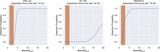
Detection probability maps for the single-star targets in our survey. Shaded green regions correspond to the location and width of the observed gaps of the disks, as derived by Huang et al. (2018a). Red lines indicate the location of the point sources presented in this work for Elias 24 and RU Lup. Our mass contrast limits are based on COND model predictions. In all cases, detection probability increases with both separation and mass, having a 50% probability for masses ∼5MJ at ≈100 au around all targets.
Other Images in This Article
Copyright and Terms & Conditions
© 2021. The American Astronomical Society. All rights reserved.

Copyright ©
2026 Astronomy Image Explorer. All Rights Reserved.
