

Image Details
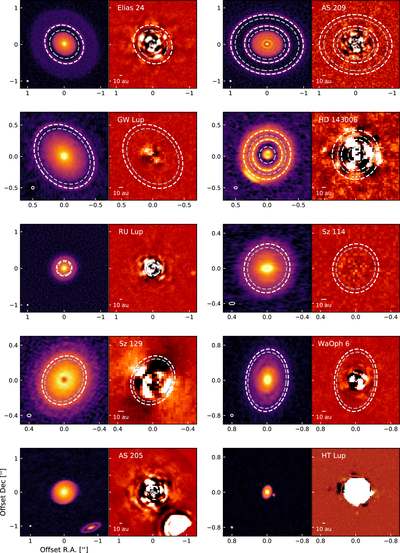
Caption: Figure 1.
ALMA and NaCo gallery of all observed targets. ALMA images (left panels) are from the DSHARP survey; NaCo images (right panels) are the results from the cADI reduction. White (gray) dashed lines mark the bright rings (dark gaps) of each disk, as derived by Huang et al. (2018a). Point-like sources are marked by a white arrow when recovered after the ADI reduction. A 10 au scale bar is shown in the lower left corner of each cADI panel, and the beam size of the ALMA images is shown in the lower left corner of each ALMA panel. In the case of HT Lup, variation of the parallactic angle was too low for proper cADI processing. The result from the PCA processing is presented instead.
Other Images in This Article
Copyright and Terms & Conditions
© 2021. The American Astronomical Society. All rights reserved.

