Image Details
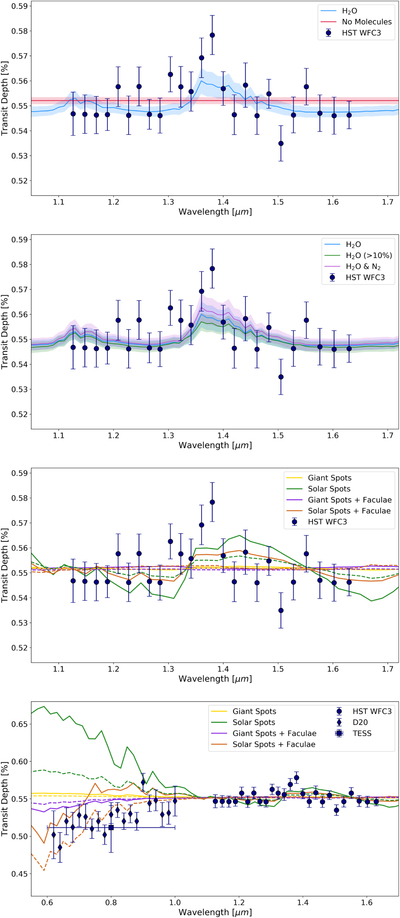
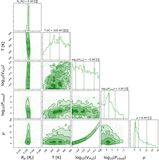
Caption: Figure 8.
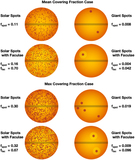
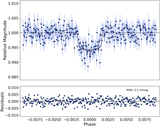
Best-fit models to the HST data from our atmosphere retrievals (top and upper-middle) and stellar contamination models (lower-middle). For the stellar contamination models, the solid lines depict the transit light source effect for the maximum spot filling factor, as defined in Rackham et al. (2018), while the dashed lines represent the mean. Transit depths from Diamond-Lowe et al. (2020) are also shown (bottom) and suggest the presence of solar spots with faculae.
Other Images in This Article

Show More
Copyright and Terms & Conditions
© 2020. The American Astronomical Society. All rights reserved.
Copyright ©
2025 Astronomy Image Explorer. All Rights Reserved.