Image Details
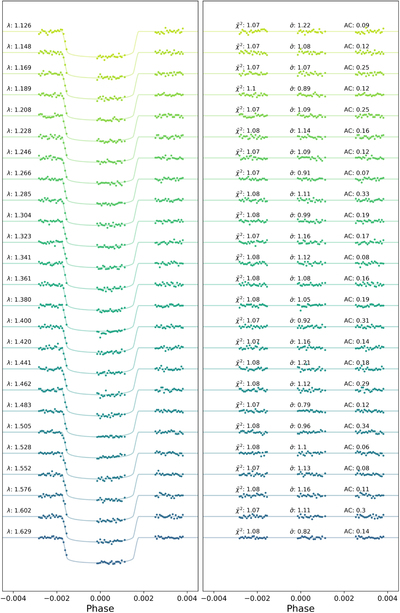
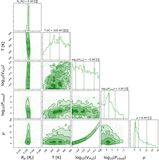
Caption: Figure 5.
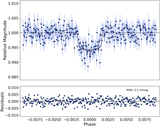
Spectral light-curve fits from Iraclis for the transmission spectra of LHS 1140b where, for clarity, an offset has been applied. In each plot, left panel: the detrended spectral light curves with best-fit model plotted; right panel: residuals from the fitting with values for the chi-squared (χ2), the standard deviation with respect to the photon noise (﹩\bar{\sigma }﹩), and the autocorrelation (AC).
Other Images in This Article

Show More
Copyright and Terms & Conditions
© 2020. The American Astronomical Society. All rights reserved.
Copyright ©
2025 Astronomy Image Explorer. All Rights Reserved.