Image Details
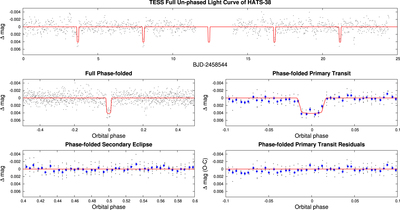
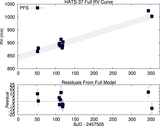
Caption: Figure 3.
Top: unbinned TESS observations of HATS-38 plotted against time simultaneously with the transit model, which is overplotted. Middle: phase-folded unbinned TESS light curve. The left panel shows the full light curve, and the right panel shows the light curve zoomed in on the transit. The solid lines show the model fits to the light curves. The blue filled circles in the middle right panel show the light curve binned in phase with a bin size of 0.002. Bottom: phase-folded TESS light curve around the predicted time of secondary eclipse (left panel) and residuals with respect to the transit model shown in the middle right panel. The black dots show the unbinned data, while the blue filled circle show values binned in phase with a bin size of 0.002.
Other Images in This Article

Copyright and Terms & Conditions
© 2020. The American Astronomical Society. All rights reserved.