Image Details
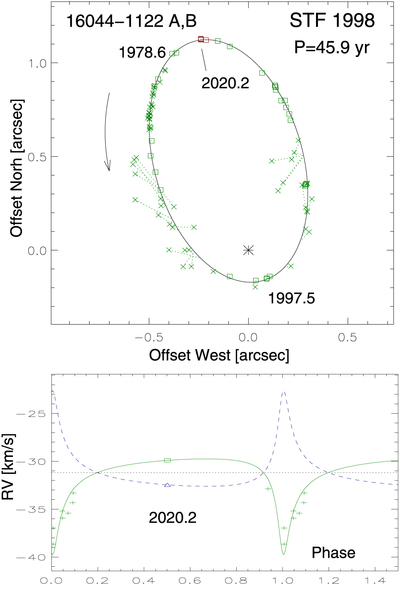
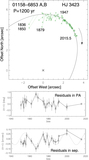
Caption: Figure 7.
Orbit of STF 1998 A,B. Accurate speckle positions are plotted as squares (the latest ones in red), selected micrometer data as crosses. The lower plot shows the RV curve with amplitudes of 5 km s−1. Crosses are RVs from Tokovinin & Smekhov (2002), square and triangle are the computed RVs in 2020.2.
Other Images in This Article
Copyright and Terms & Conditions
© 2020. The American Astronomical Society. All rights reserved.
Copyright ©
2025 Astronomy Image Explorer. All Rights Reserved.