Image Details
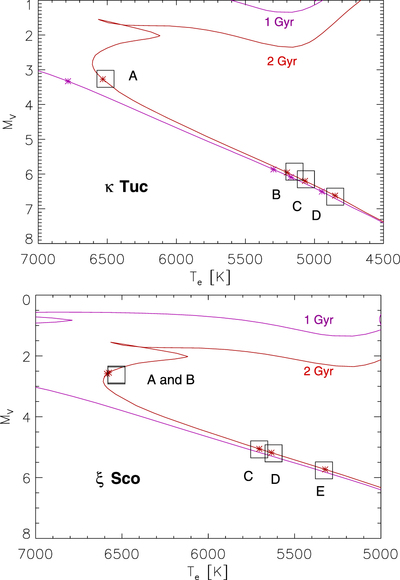
Caption: Figure 2.
Hertzsprung–Russell diagram of κ Tuc (top) and ξ Sco (bottom) based on the data of Table 1. The magenta and red lines are PARSEC isochrones (Bressan et al. 2012) for solar metallicity and ages of 1 and 2 Gyr, respectively. Asterisks on the isochrones mark the adopted masses of the components.
Other Images in This Article
Copyright and Terms & Conditions
© 2020. The American Astronomical Society. All rights reserved.
Copyright ©
2025 Astronomy Image Explorer. All Rights Reserved.