Image Details
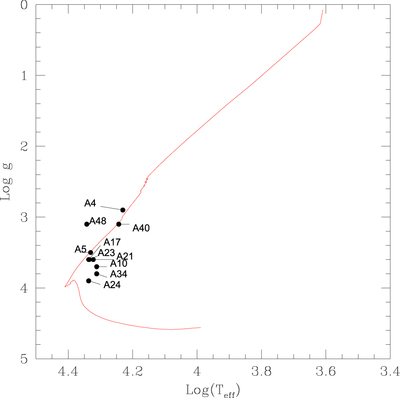
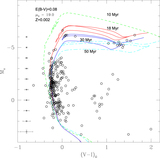
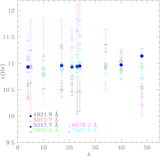
Caption: Figure 13.
log Teff − log g diagram for the stars analyzed spectroscopically by us with MUSE (black dots) considering stellar rotation. The Z = 0.002 SYCLIST isochrones of 30 Myr and ω = 0.9ωc (Georgy et al. 2014) is reported with the red solid line. We report also the names of the stars.
Other Images in This Article
Show More
Copyright and Terms & Conditions
© 2020. The American Astronomical Society. All rights reserved.
Copyright ©
2025 Astronomy Image Explorer. All Rights Reserved.