Image Details
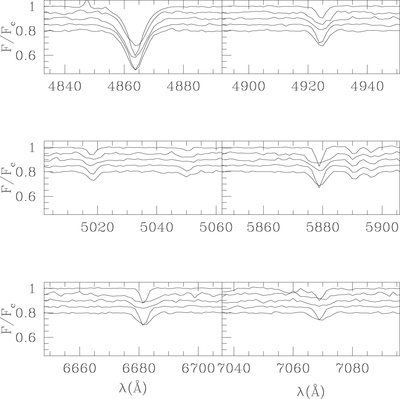
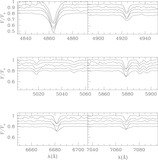
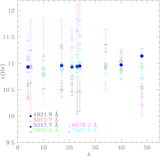
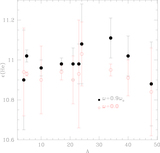
Caption: Figure 7.
Each panel shows the region of the spectrum where the He features used in this work are located. The spectra are normalized but not redshifted. In every panel the spectra of the stars A4, A5, A10, A17, and A21 are plotted starting from the top and shifted of 0.05 in the y-axis for graphical reasons.
Other Images in This Article
Show More
Copyright and Terms & Conditions
© 2020. The American Astronomical Society. All rights reserved.
Copyright ©
2025 Astronomy Image Explorer. All Rights Reserved.