Image Details
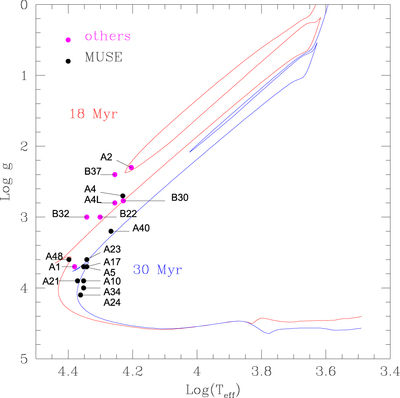
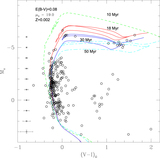
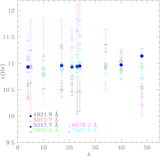
Caption: Figure 12.
log Teff − log g diagram for the stars analyzed spectroscopically by us with MUSE (black dots) and by other authors (magenta dots). The Z = 0.002 PARSEC isochrones of 18 and 30 Myr are also reported with red and blue solid lines, respectively. We also report the name of the stars. We show the log Teff and log g of A4 determined by us (A4) and by Lennon et al. (2003; A4L).
Other Images in This Article
Show More
Copyright and Terms & Conditions
© 2020. The American Astronomical Society. All rights reserved.
Copyright ©
2025 Astronomy Image Explorer. All Rights Reserved.