Image Details
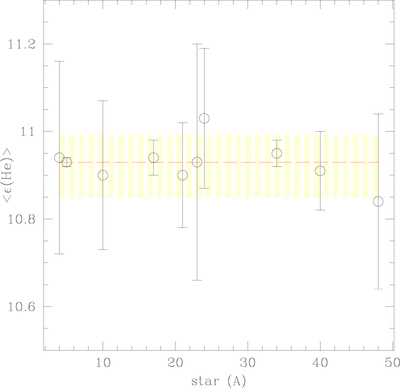
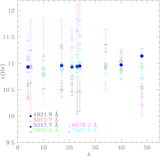
Caption: Figure 11.
Mean value of the logarithmic He abundance for each target. Error bars are also shown. The red dashed line represents the average of these values, while the yellow shadow region shows the ±1σ level.
Other Images in This Article
Show More
Copyright and Terms & Conditions
© 2020. The American Astronomical Society. All rights reserved.
Copyright ©
2025 Astronomy Image Explorer. All Rights Reserved.