Image Details
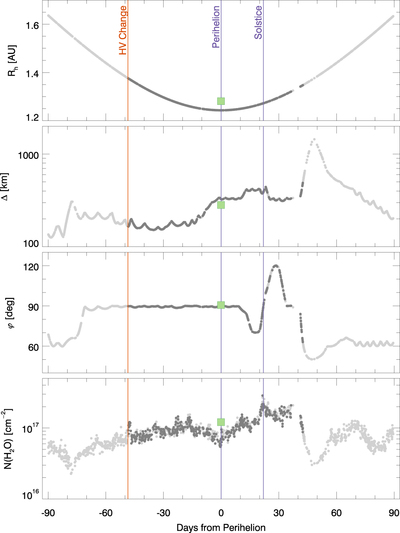
Caption: Figure 1.
Variation in observing geometry near 67P/C-G’s perihelion passage of 2015 August 13. From top to bottom, the panels show the heliocentric distance, Rh, the spacecraft–comet distance, Δ, the solar phase angle, ϕ, and the column density of water, ﹩{N}_{{{\rm{H}}}_{2}{\rm{O}}}﹩, as a function of time. The gray points show exposures that include the nucleus and have stable pointing, with the dark gray points showing the subset of exposures that contribute to our grand sum (Section 3); the large green squares show the weighted mean values for the grand sum, where each exposure is weighted by ﹩{N}_{{{\rm{H}}}_{2}{\rm{O}}}\,{t}_{\exp }^{1/2}/{R}_{h}^{2}﹩. The bottom panel uses a modified version of the Hansen et al. (2016) empirical coma model to predict ﹩{N}_{{{\rm{H}}}_{2}{\rm{O}}}﹩ at a given slit position in Alice exposures (see the text for details). The locations of perihelion, solstice, and an Alice high-voltage change (Pineau et al. 2019) are also shown.
Other Images in This Article
Copyright and Terms & Conditions
© 2019. The American Astronomical Society. All rights reserved.