Image Details
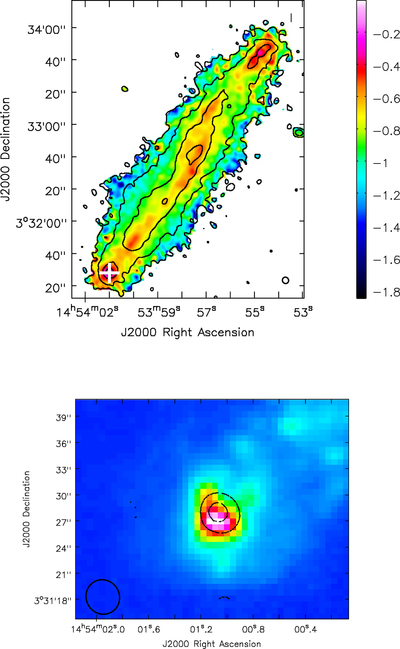
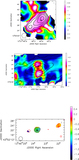
Caption: Figure 6.
NGC 5775. Top: total intensity BL rob 0 contours over spectral index image with color scale shown at right. The beam of the spectral index image is shown in the lower right corner. Contours are at 42 (3σI), 150, 500, and 1400 μJy beam−1. The H II region complex discussed in Section 6.1 is at the far SE of the disk and denoted with a plus sign. Bottom: blow-up of the SE H II region complex showing two dashed spectral index contours (α = −0.3 and −0.25; the latter is smaller) over the Hα image from Collins et al. (2000) in color. The Hα pixel size is 0.″68. The spectral index beam size is shown in the lower left corner.
Other Images in This Article
Copyright and Terms & Conditions
© 2019. The American Astronomical Society. All rights reserved.