Image Details
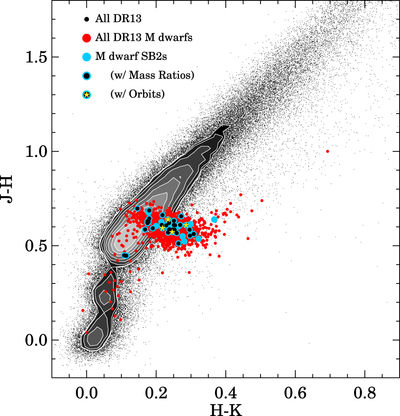
Caption: Figure 1.
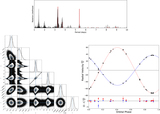
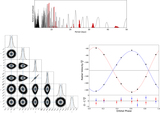
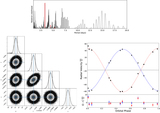
J − H vs. ﹩H-{K}_{s}﹩ color–color diagram of DR13 APOGEE targets. The full DR13 sample is shown as small points and gray-scale contours in areas of color space where individual points can no longer be distinguished. The M-dwarf ancillary targets are shown as red dots, demonstrating the clear divergence from the reddened giant branch that makes up the bulk of the APOGEE data set. Candidate SB2s are indicated with cyan dots; sources for which we infer mass ratios and full orbital fits are highlighted with a black central dot and surrounding ring, respectively.
Other Images in This Article
Copyright and Terms & Conditions
© 2018. The American Astronomical Society. All rights reserved.
Copyright ©
2026 Astronomy Image Explorer. All Rights Reserved.