Image Details
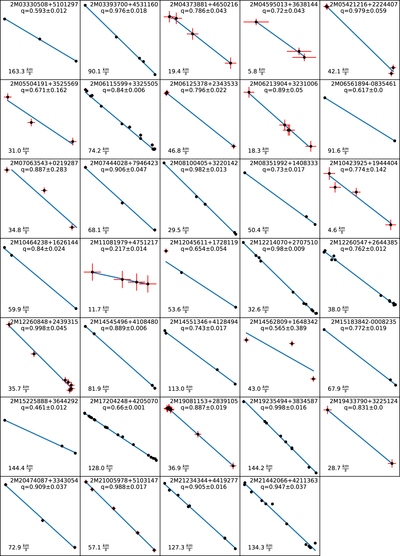
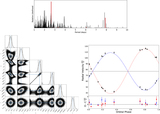
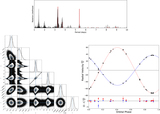
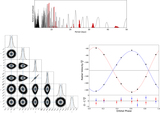
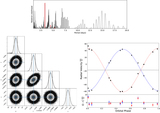
Caption: Figure 4.
Wilson plots of each mass-ratio measurement in our sample. The black circles are RV observations. Uncertainties are shown as red bars. The blue line of each plot is the best-fit line to the data, from which the mass ratio is calculated. The horizontal axis is vsec, and the vertical axis is vprim. The aspect ratio between the vertical and horizontal axes of each subplot is 1. In the lower left corner of each subplot, the vsec range is given.
Other Images in This Article
Copyright and Terms & Conditions
© 2018. The American Astronomical Society. All rights reserved.
Copyright ©
2024 Astronomy Image Explorer. All Rights Reserved.