Image Details
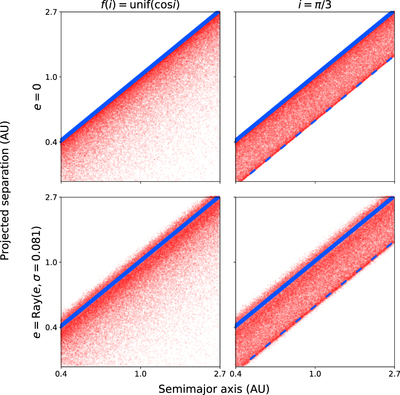
Caption: Figure 4.
Density scatter plots showing the distribution of projected separation with semimajor axis for different assumptions about eccentricity and inclination distributions. The solid blue line indicates 1:1 correspondence, aproj = a. The dashed blue line shows ﹩{a}_{\mathrm{proj}}=a\cos i﹩, which is the minimum aproj for fixed inclination and circular orbits. The distribution of aproj with a is bimodal for fixed inclination (right column) because the apparent orbital speed of the planet has minima at both aproj = a and ﹩{a}_{\mathrm{proj}}=a\cos i﹩, effectively piling-up planets at these four points on the orbit.
Other Images in This Article

Copyright and Terms & Conditions
© 2018. The American Astronomical Society. All rights reserved.