Image Details
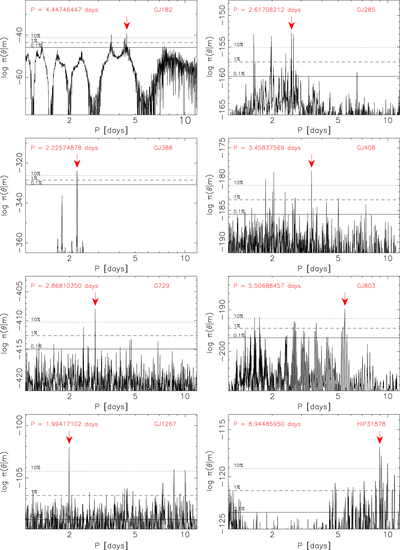
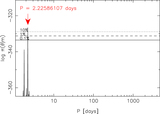
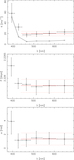
Caption: Figure 13.
Estimated posterior probability density as a function of the period of the signal. The horizontal lines denote the 10% (dotted), 1% (dashed), and 0.1% (solid) equiprobability thresholds with respect to the maximum denoted by the red arrows.
Other Images in This Article
Show More
Copyright and Terms & Conditions
© 2018. The American Astronomical Society.
Copyright ©
2026 Astronomy Image Explorer. All Rights Reserved.