Image Details
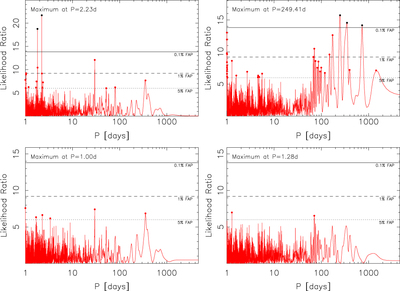
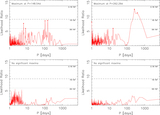
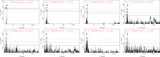
Caption: Figure 4.
Logarithm of the likelihood ratio periodogram of the ASAS-N (left panels) and ASAS-S (right panels) V-band photometry of AD Leo when accounting for the long-period variability seen in Figure 2. The bottom panels show the residual periodogram after subtracting the strongest periodic signal. The red (black) filled circles denote the maxima exceeding the 5% (0.1%) FAP threshold.
Other Images in This Article
Show More
Copyright and Terms & Conditions
© 2018. The American Astronomical Society.
Copyright ©
2024 Astronomy Image Explorer. All Rights Reserved.