Image Details
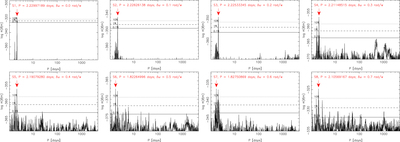
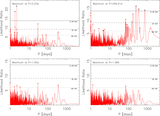
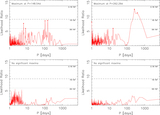
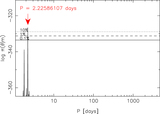
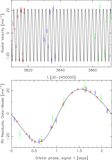
Caption: Figure 10.
Estimated posterior probability densities as functions of signal period for artificial data sets with injected signals. The rate of change in the phase of the signals (δω) is denoted in each panel in rad week–1. The red arrows denote the global probability maxima, and the horizontal lines indicate the 10% (dotted), 1% (dashed), and 0.1% (solid) equiprobability thresholds with respect to the maxima.
Other Images in This Article
Show More
Copyright and Terms & Conditions
© 2018. The American Astronomical Society.
Copyright ©
2024 Astronomy Image Explorer. All Rights Reserved.