Image Details
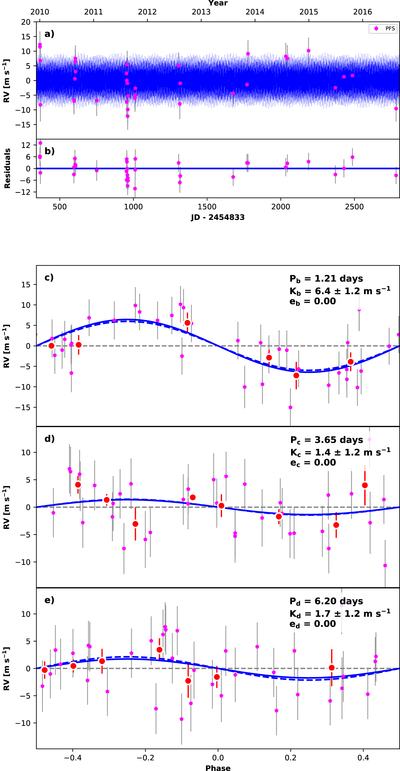
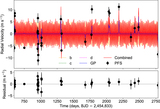
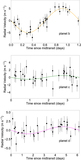
Caption: Figure 5.
Subplot a: maximum likelihood Keplerian model from RADVEL (blue) plotted with the GJ 9827 PFS RV data (magenta). The plotted uncertainties are the quadrature sum of the measurement uncertainties and the best-fit jitter term. Subplot b: the residuals to the fit in a. Subplots c, d, and e: the phased, individual planet (best) RV fits from RADVEL, with RVs binned in 0.08 units of orbital phase shown in red and the fits shown in solid blue. The upper left corner of each of these subplots also lists the planet period and eccentricity (held constant), and the maximum likelihood (best fit) RV semi-amplitude K. For comparison, the curves over-plotted in dashed blue represent the SYSTEMIC best-fit RV semi-amplitudes.
Other Images in This Article
Copyright and Terms & Conditions
© 2018. The American Astronomical Society. All rights reserved.