Image Details
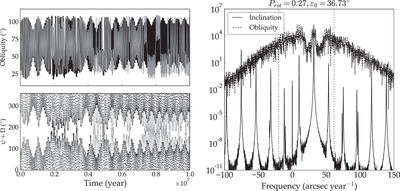
Caption: Figure 18.
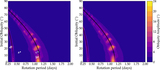
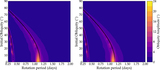
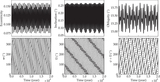
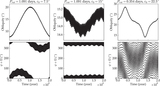
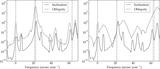
Evolution of the obliquity and the angle ﹩\psi +{\rm{\Omega }}﹩ (left) for the Earth-mass planet at point h in Figure 13, and the power spectra of the inclination and obliquity variables (right). Vertical dashed lines represent the minimum and maximum axial precession rates, which vary with obliquity. The broad peak of the obliquity variables is indicative of chaotic motion.
Other Images in This Article

Show More
Copyright and Terms & Conditions
© 2018. The American Astronomical Society. All rights reserved.
Copyright ©
2025 Astronomy Image Explorer. All Rights Reserved.