Image Details
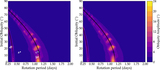
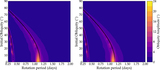
Caption: Figure 16.
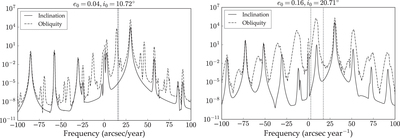
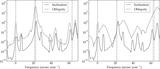
Power spectra of the obliquity and inclination evolution for the Earth-mass planet in TSYS, at points a (left) and b (right) from Figure 13. The vertical dotted lines correspond to the minimum and maximum natural axial precession rate (Equation (14)), which varies because the obliquity varies. Outside the secular resonance, the axial precession frequency falls in between peaks in the inclination spectrum. Within the resonance, this natural precession frequency falls right on top of an inclination peak at ≈10 arcsec year−1.
Other Images in This Article

Show More
Copyright and Terms & Conditions
© 2018. The American Astronomical Society. All rights reserved.
Copyright ©
2025 Astronomy Image Explorer. All Rights Reserved.