Image Details
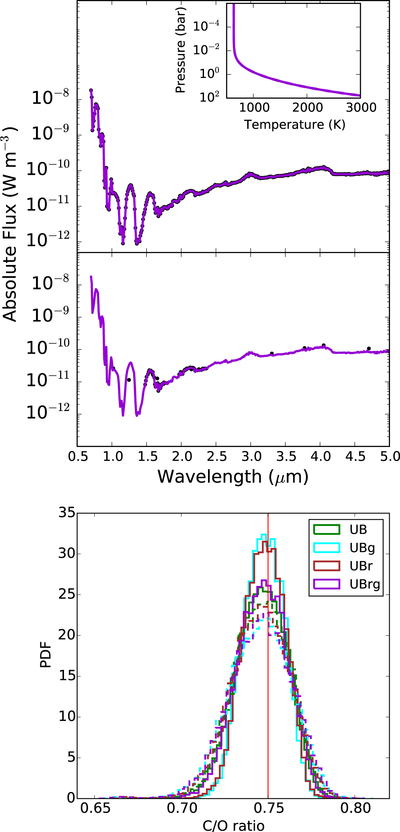
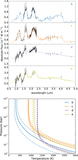
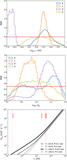
Caption: Figure 5.
Further results from the retrievals on the mock data set. The top panel shows the mock data set at full resolution (0.01 μm), and also with HR 8799b-like data coverage (circles). The mock data set and best-fit spectrum overlap exactly (to within the resolution of the plot). The insert shows the retrieved temperature–pressure profile. The bottom panel shows the retrieved posterior distributions of C/O, assuming different models (see Table 1). The solid and dotted curves are for HR 8799b-like and HR 8799e-like data coverage. The broader posterior distributions of C/O associated with HR 8799e-like data coverage are primarily due to the lack of K-band data.
Other Images in This Article
Show More
Copyright and Terms & Conditions
© 2017. The American Astronomical Society. All rights reserved.