

Image Details
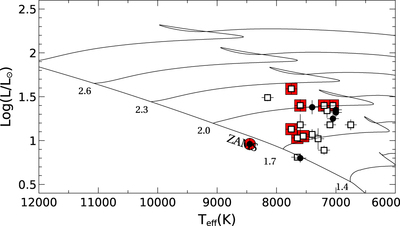
Caption: Figure 4.
HR diagram of the miscellaneous sample λ Boo stars with Gaia parallaxes (Gaia Collaboration et al. 2016a, 2016b), excluding the Herbig Ae stars. The temperatures are from Table 2, and the evolutionary tracks (Z = 0.02) are from Bressan et al. (2012). The filled circles represent stars discovered with the Strömgren ﹩[{m}_{1}]\mbox{--}[{c}_{1}]﹩ method, and the open squares represent candidates from Murphy et al. (2015). Note that, as in Figure 3, all of the λ Boo stars in the miscellaneous sample lie between the ZAMS and the TAMS. Stars showing infrared excesses attributable to a debris disk (see Table 4 and Section 5.2) are indicated with a red “halo” around the data point.
Other Images in This Article
Copyright and Terms & Conditions
© 2017. The American Astronomical Society. All rights reserved.

