

Image Details
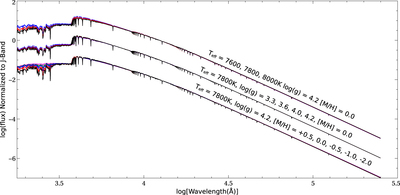
Caption: Figure 2.
Model flux distributions for various ranges of ﹩{T}_{\mathrm{eff}}﹩, ﹩\mathrm{log}g﹩, and metallicity, demonstrating the insensitivity of the infrared Rayleigh–Jeans tail to changes in those physical parameters. All of these flux distributions are normalized to unity at the effective wavelength of the 2MASS J-band, 1.235 μm, but have been displaced by one unit in the ﹩\mathrm{log}﹩ for clarity. The top plot shows the variation in the flux distributions for effective temperatures in the mid-A star range. Differences in the UV are evident, but the infrared Rayleigh–Jeans tails practically coincide. Much the same can be seen for the middle plots, which explore changes with ﹩\mathrm{log}g﹩. Likewise for the lower plots for metallicity. However, for the metallicity plots, note the large differences in line blanketing in the ultraviolet. Flux distributions were computed with SPECTRUM using Castelli & Kurucz (2003) models.
Other Images in This Article
Copyright and Terms & Conditions
© 2017. The American Astronomical Society. All rights reserved.

