Image Details

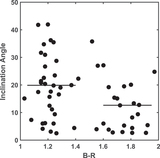
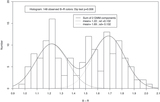
Caption: Figure 5.
Centaur B – R colors and semimajor axes, a. The horizontal lines represent the median a values of the gray and red Centaurs. Application of the Wilcoxon rank sum test gives only a 31% confidence level that red and gray Centaurs have different a distributions. We see no evidence of a difference in the semimajor axis distributions of the gray and red Centaurs.
Other Images in This Article

Copyright and Terms & Conditions
© 2016. The American Astronomical Society. All rights reserved.
Copyright ©
2024 Astronomy Image Explorer. All Rights Reserved.