Image Details
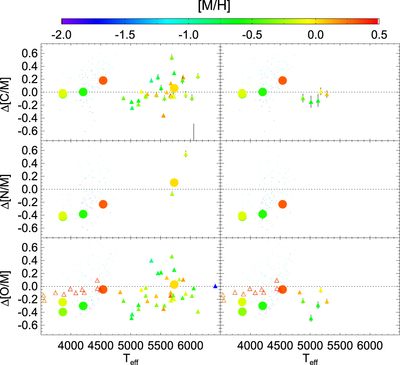
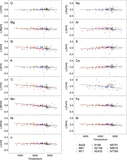
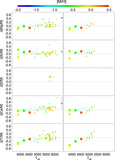
Caption: Figure 8.
Comparison with literature abundances for CNO elements. Left panel is uncalibrated ASPCAP results; right is for calibrated results. Differences are ASPCAP minus reference values. Large circles are abundances from FTS spectra (Smith et al. 2013), filled triangles from optical spectra and analysis, open triangles from independent analysis of APOGEE spectra (Cunha et al. 2015), and small points from Mészáros et al. (2015). The empirical uncertainties as discussed in the text are shown as error bars, but these are often comparable or smaller than the size of the points.
Other Images in This Article
Show More
Copyright and Terms & Conditions
© 2015. The American Astronomical Society. All rights reserved.
Copyright ©
2025 Astronomy Image Explorer. All Rights Reserved.