Image Details
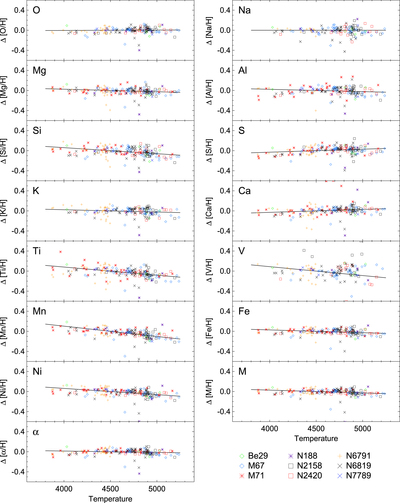
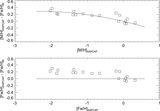
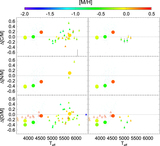
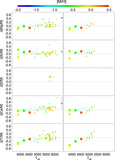
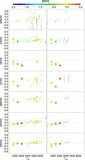
Caption: Figure 5.
Internal elemental abundance calibrations. Plots show deviations of individual elements relative to the cluster means as a function of temperature; these have been defined to be zero at 4500 K. Different symbols are for different clusters, as noted in lower right. Lines shows the adopted temperature calibrations. Carbon and nitrogen are not shown because we cannot assume homogeneous abundances within clusters.
Other Images in This Article
Show More
Copyright and Terms & Conditions
© 2015. The American Astronomical Society. All rights reserved.
Copyright ©
2025 Astronomy Image Explorer. All Rights Reserved.