Image Details
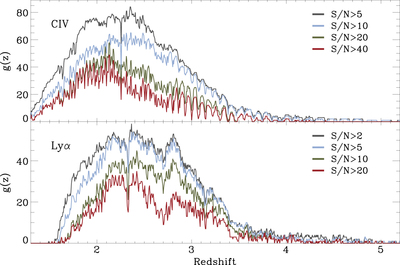
Caption: Figure 9.
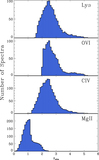
Redshift sensitivity function g(z) for C IV and Lyα absorption of the 170 quasars in DR1. The sharp downward spikes result from the effect of the mosaic detector gaps. The high frequency variations result from the effects of the echelle blaze function.
Other Images in This Article
Copyright and Terms & Conditions
© 2015. The American Astronomical Society. All rights reserved.
Copyright ©
2025 Astronomy Image Explorer. All Rights Reserved.