Image Details
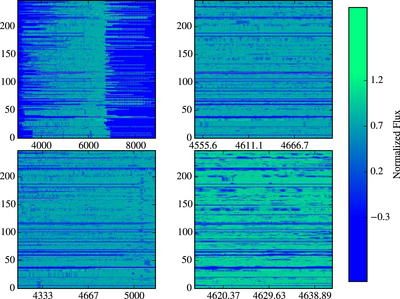
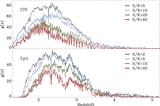
Caption: Figure 6.
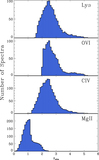
Spectral image of the full DR1 dataset. The data are rebinned to 500 spectral pixels. The panels show the dataset at various wavelength scales (on the x-axis) to illustrate the effects of instrument setup at the largest scales (upper-left panel) down the level of the the influence of the Lyα forest (lower-right panel).
Other Images in This Article
Copyright and Terms & Conditions
© 2015. The American Astronomical Society. All rights reserved.
Copyright ©
2025 Astronomy Image Explorer. All Rights Reserved.