Image Details

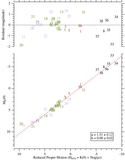
Caption: Figure 15.
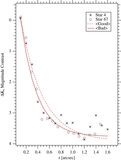
Average x residual from the Section 5.5 modeling plotted against average mf, scaled in millipixel on the left and mas on the right. The solid curve is a quadratic fit to average reference star residuals resulting from the modeling in Section 5.3. Also plotted are the upper and lower bounds within which 99% of the Section 5.3 reference stars are expected to fall. These stars are plotted with the smallest ID numbers. The KOI are plotted with larger symbols. The nine confirmed planetary system host stars are plotted with large bold symbols. All KOI ID numbers are from Table 4. Clearly, KOI 426 and 452 are astrometrically peculiar, and the nine planetary system host stars behave as expected.
Other Images in This Article

Show More
Copyright and Terms & Conditions
© 2014. The American Astronomical Society. All rights reserved.