Image Details
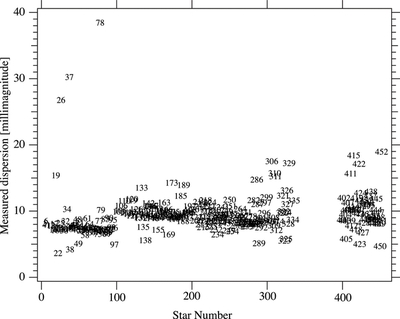
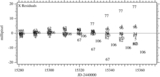
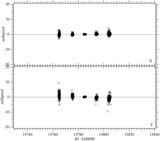
Caption: Figure 14.
Measured photometric dispersion (mf standard deviation) over 2.1 y with a nine day cadence for each star modeled in Section 5.3. Giants (1–100) exhibit the highest overall variability. Other groups are the hot star sample (101–199), mid-range Teff (201–299), the K–M star sample (300–350), and the KOI sample (400–452). The trends to smaller photometric variation with number within each sample group (as defined in Section 5.1) may be a function of position within Channel 21. The lowest variations are closer (x, y) = (0, 1000) while the highest are closer (x, y) = (1000, 0).
Other Images in This Article

Show More
Copyright and Terms & Conditions
© 2014. The American Astronomical Society. All rights reserved.
Copyright ©
2025 Astronomy Image Explorer. All Rights Reserved.