Image Details
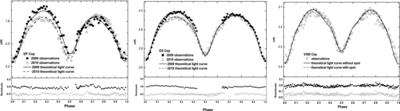
Caption: Figure 4.
Comparison between the observed and theoretical light curves of EP, ES, and V369 Cep. Left panel: the solid line represents the synthetic light curve with a dark spot on the secondary of EP Cep and the dashed line refers to the synthetic light curve with a dark spot on the primary of EP Cep. Middle panel: the solid line shows the theoretical light curve with a dark spot on the secondary of ES Cep, and the dashed line displays the theoretical light curve with two dark spots on the secondary of ES Cep. The corresponding residuals are shown in the lower panels of the left and middle panels. Right panel: open circles in the upper panel denote the observations of V369 Cep. The solid line shows the theoretical light curve of V369 Cep without spots. Dots in the lower panel are the corresponding residuals. The dashed line shows the theoretical light curve with a hot spot on the secondary of this system. The corresponding residuals are shown in the lower panel with open circles.
Other Images in This Article
Copyright and Terms & Conditions
© 2014. The American Astronomical Society. All rights reserved.