Image Details
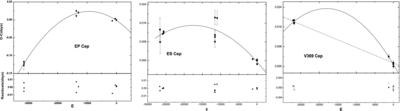
Caption: Figure 2.
O − C curves of EP Cep (left), ES Cep Per (middle), and V369 Cep (right). The solid lines represent the quadratic fit curves. The dashed line refers to the linear fit. Dots in the upper panels represent CCD observations. All residuals are shown in the lower panels with dots (quadratic fit) and open circles (linear fit).
Other Images in This Article
Copyright and Terms & Conditions
© 2014. The American Astronomical Society. All rights reserved.
Copyright ©
2025 Astronomy Image Explorer. All Rights Reserved.