Image Details
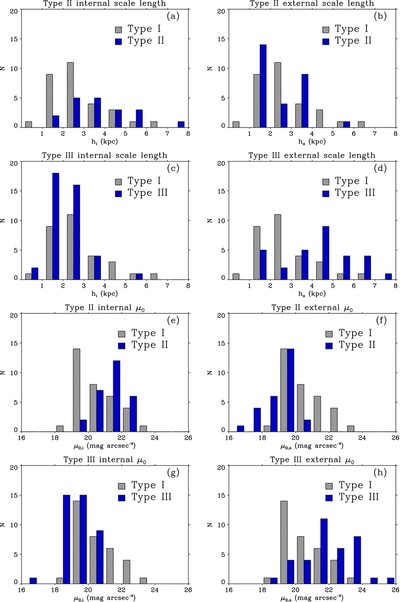
Caption: Figure 11.
Distributions of scale length h, in units of kpc, and of extrapolated central surface brightness μ 0. We show these separately for the inner and outer exponential fits where there is a truncation (Type II) or an antitruncation (Type III); these are compared in each panel with h or μ 0 for the single exponentials of Type I profiles (hashed black bars). This plot uses data from our sample data and includes the early-type barred galaxies from Paper I. As in Figure 10, the blue and hashed black bars represent all the galaxies of each type in the given bin range, but are presented with the intervals between them for greater clarity.
Other Images in This Article
Show More
Copyright and Terms & Conditions
© 2011. The American Astronomical Society. All rights reserved.