Image Details
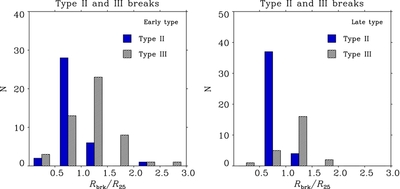
Caption: Figure 10.
Histograms of break radii for Type II and III profiles, in units of R 25, including barred and unbarred galaxies. The left-hand panel uses data from this paper and Paper I (S0–Sb galaxies), while the right-hand panel uses data from PT06 (Sbc–Sdm galaxies). The blue and hashed black bars represent all the galaxies of each type in a given bin range, but are presented with the intervals between them for greater clarity, since we are plotting two histograms together.
Other Images in This Article
Show More
Copyright and Terms & Conditions
© 2011. The American Astronomical Society. All rights reserved.
Copyright ©
2026 Astronomy Image Explorer. All Rights Reserved.