Image Details
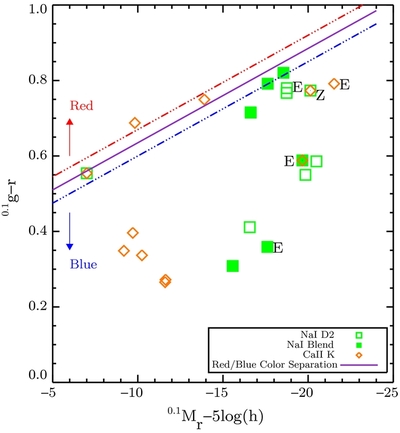
Caption: Figure 11.
Plot of galaxy g− r color vs. galaxy SDSS r-band absolute magnitude, for the list of absorbers. The purple line corresponds to the average of the red/blue galaxy cutoffs from Yan et al. (2006). Applying the cut divides our sample into 5 red galaxies and 19 blue galaxies. Galaxies between the red and blue regions are more ambiguous in their classification. The absorbers marked with "E" and "Z" represent the four extragalactic absorbers, and the Zych absorber, discussed in Section 5. All absolute magnitudes were calculated using distances derived from heliocentric redshifts, with the exception of the four Virgo Cluster galaxies. For those galaxies, distances were derived from redshifts corrected for the Local Group infall toward Virgo, taken from HyperLeda (Paturel et al. 2003).
Other Images in This Article


Show More
Copyright and Terms & Conditions
© 2011. The American Astronomical Society. All rights reserved.