Image Details
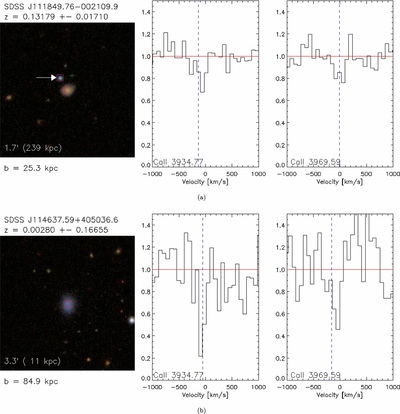
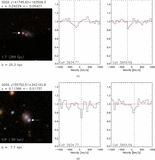
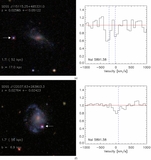
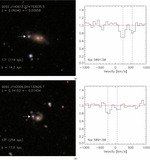
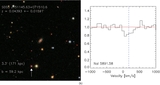
Caption: Figure 3.
Subset of Ca ii absorbers: the image is centered on the galaxy position, scaled to focus on the galaxy in each pair. For cases where the QSO is within the image, it is marked with a white arrow. In other cases, scaling the image to show both the galaxy and QSO results in a loss of detail regarding both objects. All objects with an SDSS spectrum are marked with a red square. The galaxy name and redshift are displayed at the top. In the lower left is the image size. Below that is the impact parameter between the quasar and galaxy. The absorption lines detected are shown on the right. The y-axis shows the normalized flux. The middle panel displays the strong line at 3934.77 Å, with the weaker line at 3969.59 Å on the right. Each panel is centered in velocity space on the galaxy redshift. The dashed blue line marks the velocity offset of the line from the host galaxy. The red line marks the normalized continuum.
Other Images in This Article


Show More
Copyright and Terms & Conditions
© 2011. The American Astronomical Society. All rights reserved.